Most mid-sized courier companies are drowning in delivery data. On-time and failed delivery rates, route durations, cost per delivery – it all piles up. Yet despite sitting on a goldmine of information, few courier companies know how to use it.
The couriers that are growing aren't necessarily collecting more data. Nor do they have data teams. They've figured out how to turn the “signals” in their last mile delivery analytics into usable insights, to make faster, smarter operational decisions.
Combining them with their hard-won experience, they spot patterns before they compound. They balance driver workloads before burnout happens. And identify unprofitable contracts before profit margins erode.
For the fundamentals of what to measure, see our guide on 17 essential last-mile metrics - this piece explores how operators turn those metrics into action.
What last mile delivery analytics is (and isn't)
Last mile delivery analytics is the process of turning delivery data – stop times, route duration, success rates, labour hours, fleet utilisation – into signals that help operators make better decisions. It’s not just measurement, it’s the interpretation of those signals to reveal opportunities courier companies can turn into profit. At its core, delivery analytics helps you see what’s happening across your operation sooner, so you can intervene earlier.
What it isn't
Delivery analytics isn't just about dashboards. And it doesn’t replace your 15 years of dispatch experience – it amplifies it, by highlighting the 15-20% you can’t see.
For example: Raw data tells you a driver took 12 minutes at a stop. Analytics alone can't tell you why. Was it an apartment building with confusing access? A pallet delivery requiring a loading dock? An injured driver moving slower than usual?
This is where many courier companies go wrong. They expect analytics to hand them perfect answers. But delivery operations are too messy for that. A single difficult apartment complex, one driver's injury, or a rural route with long gaps between stops can distort almost every report you run. Data without operator judgment leads to wrong conclusions.
When dispatchers don't understand how a metric is built, they might see "long stop time" in their analytics and assume there's a driver performance issue – when really, it's just a challenging delivery environment.
The real delivery analytics formula
Analytics that drive sustainable profits for courier operations follow a pattern:
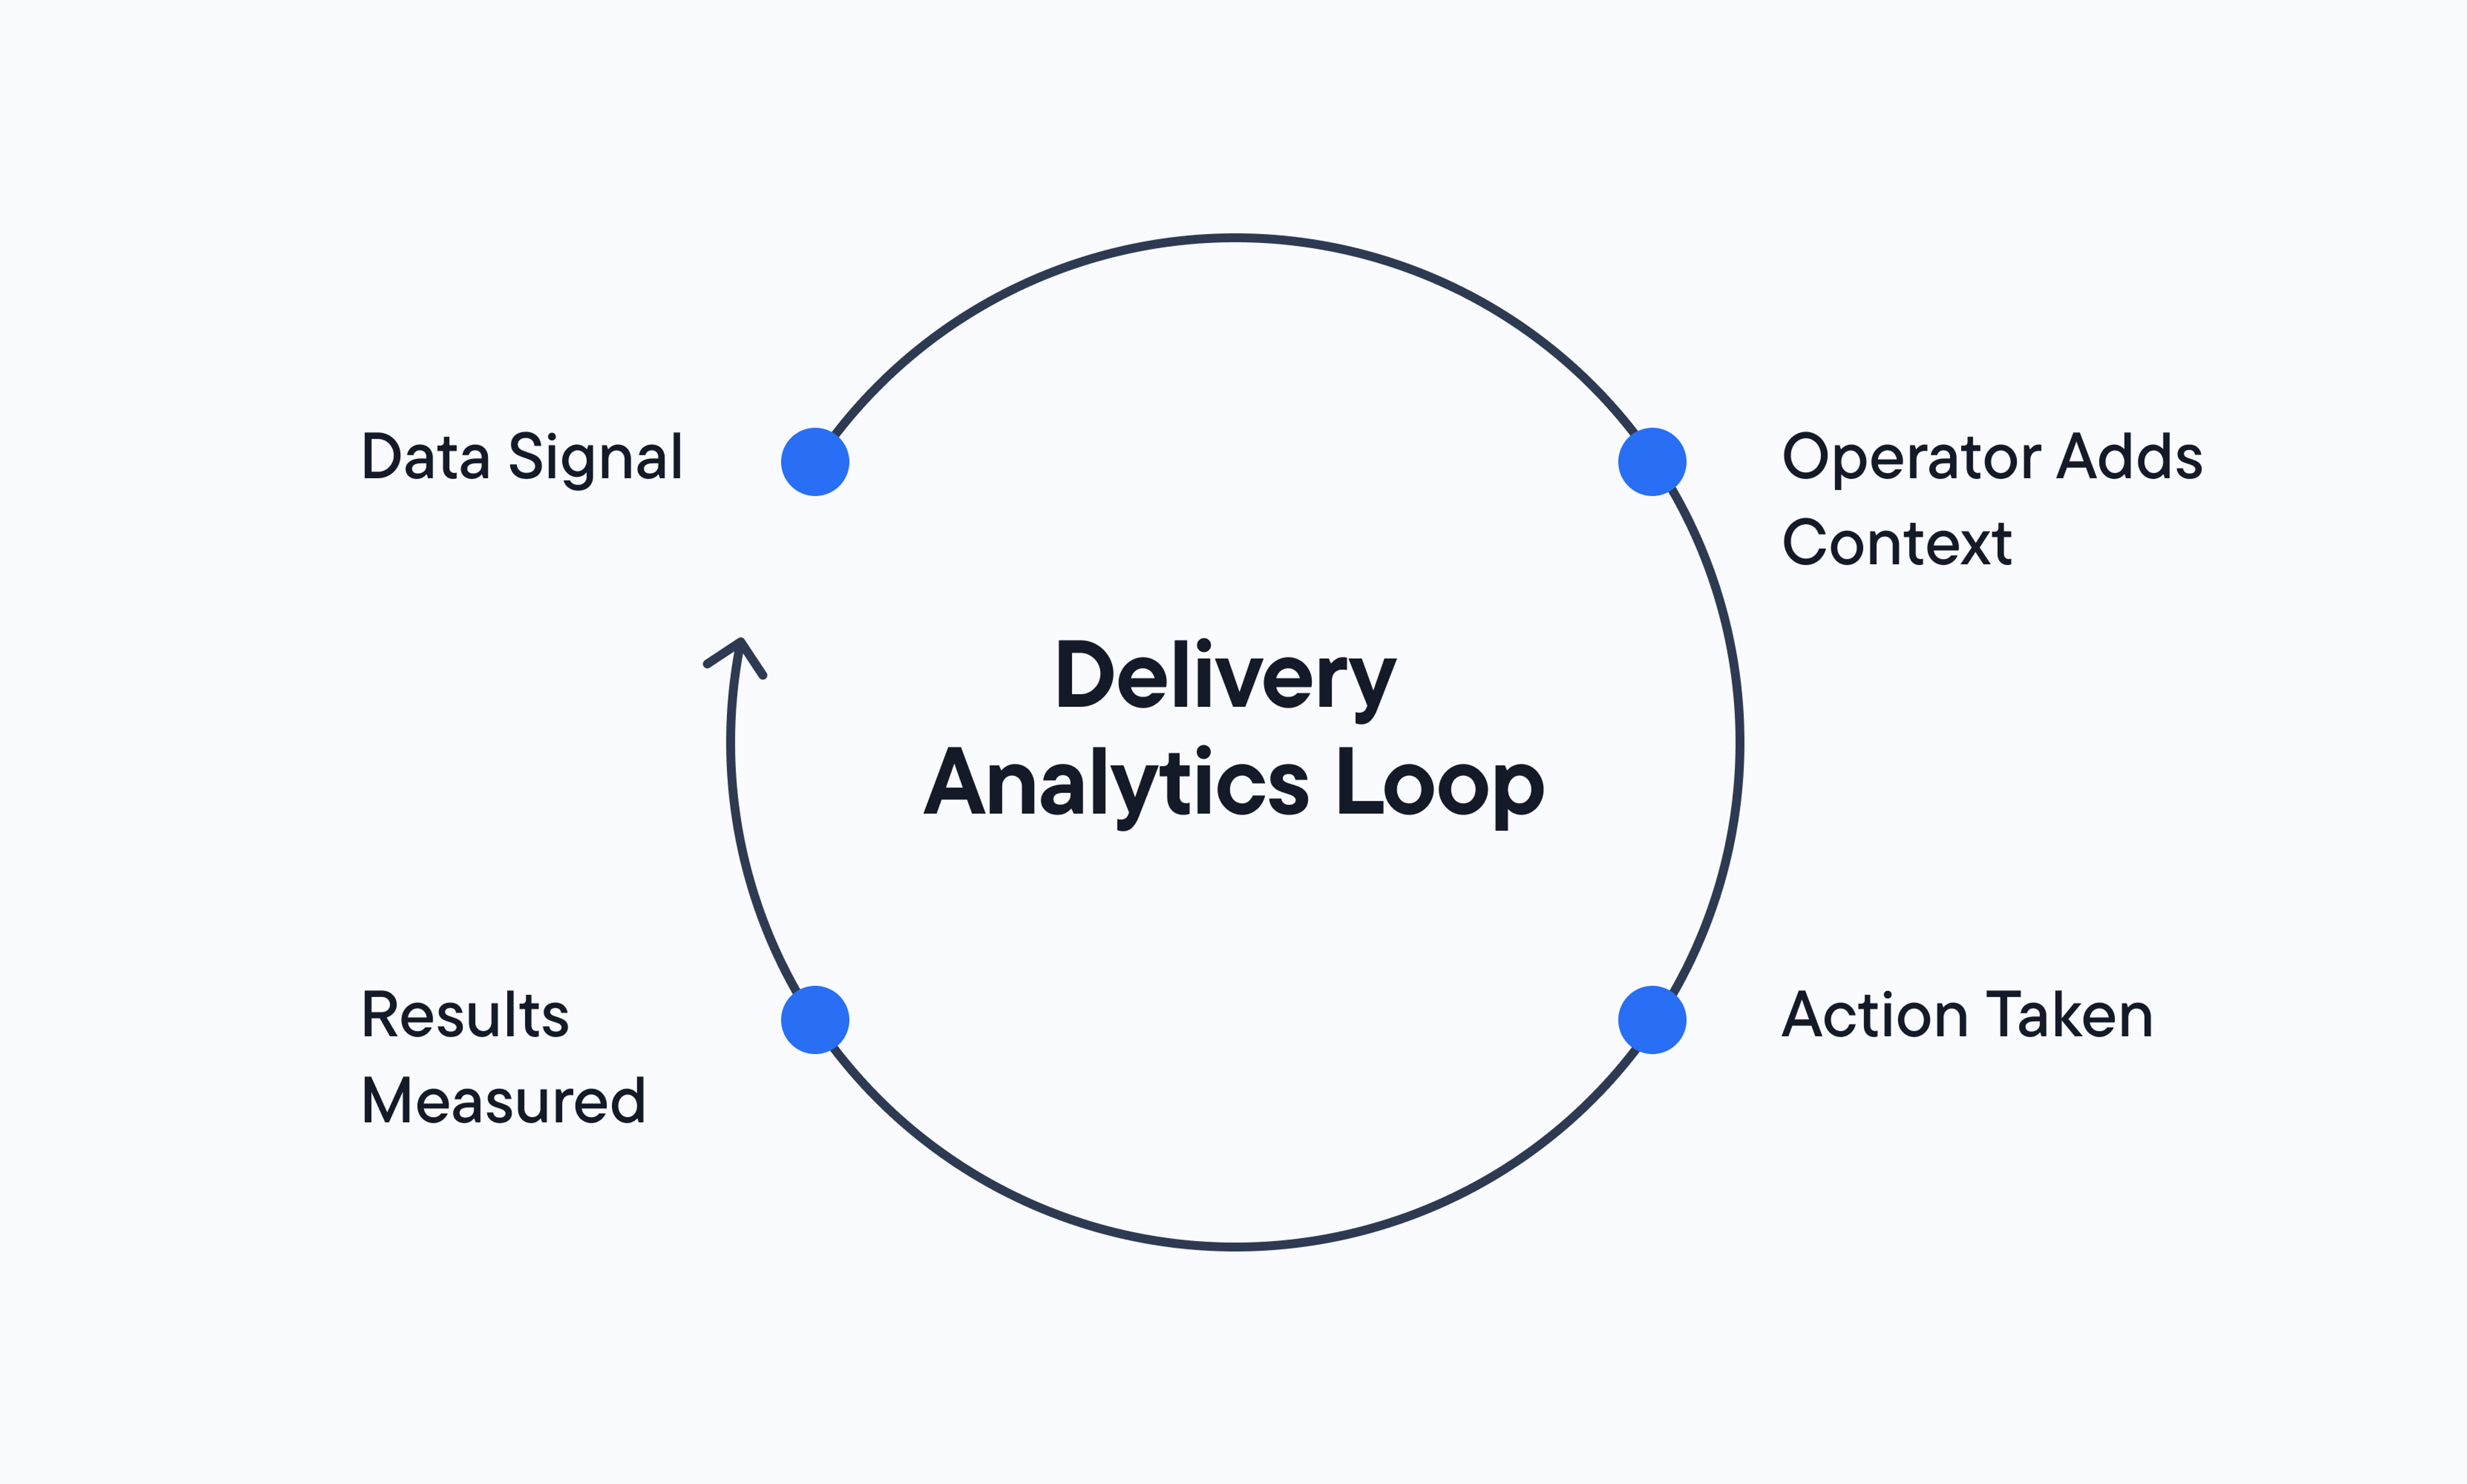
Data signal → Operator adds context → Action taken → Results measured
How this pattern plays out
Data signal: Driver A's stop-time jumped from 4 to 8 minutes over three weeks.
Operator adds context: The operations manager talks to the driver and discovers he’s nursing an injury.
Action taken: The route’s adjusted to remove complex multi-floor deliveries while the driver recovers.
Result: Productivity returns to baseline, and the company avoids the $8,000+ cost of replacing a trained driver.
"Sometimes you just can't look at the data in isolation from your knowledge of the areas and the drivers. One route might be all urban, another might be a mix of urban and rural, or one could be entirely rural. When you look at them on a list they all look the same. But when you delve a bit deeper, they can be totally different.”

This is why combining your delivery analytics with your instinct, gives you the best of both worlds – you get to be right (or wrong) faster… and prove it with numbers.
The 5 operational problems delivery analytics solves
Let’s dig into the real problems that erode your profit – and how analytics helps you spot and fix them.
Most of the profit lost doesn’t come from one big catastrophic failure – it’s ten small inefficiencies that leak money, every day.
For example: A mid-size courier handling 20,000 deliveries per month, who’s losing just $0.50 per delivery to hidden inefficiencies, wastes $120,000 profit per year. That can’t be ignored.
But there’s not necessarily anything glaringly wrong. Often, it comes from the compound effect of lots of little problems that can't quite be seen. Delivery analytics makes invisible problems visible.
Problem 1: failed deliveries (the biggest cost leak)
Every failed first-attempt delivery is money thrown away. You've paid for fuel, driver time, vehicle maintenance, and the opportunity cost of making the delivery, then you pay again with the reattempt and burn customer goodwill.
Ecommerce research by Loqate shows that in the US, 8% of first-time deliveries fail at an average cost of $17.20 – totalling $193,730 annually for a typical operation.
Failed deliveries are a big one for us because it's a loss of revenue. Using analytics, we can see where the problems are – if it's a problem area, a problem driver, or maybe the route’s overloaded.
Analytics helps you see why deliveries are failing: Is it "recipient not home”? Wrong addresses? Nowhere to park? One driver with too many failures? Data points you in the right direction to investigate, so you can make changes where necessary.
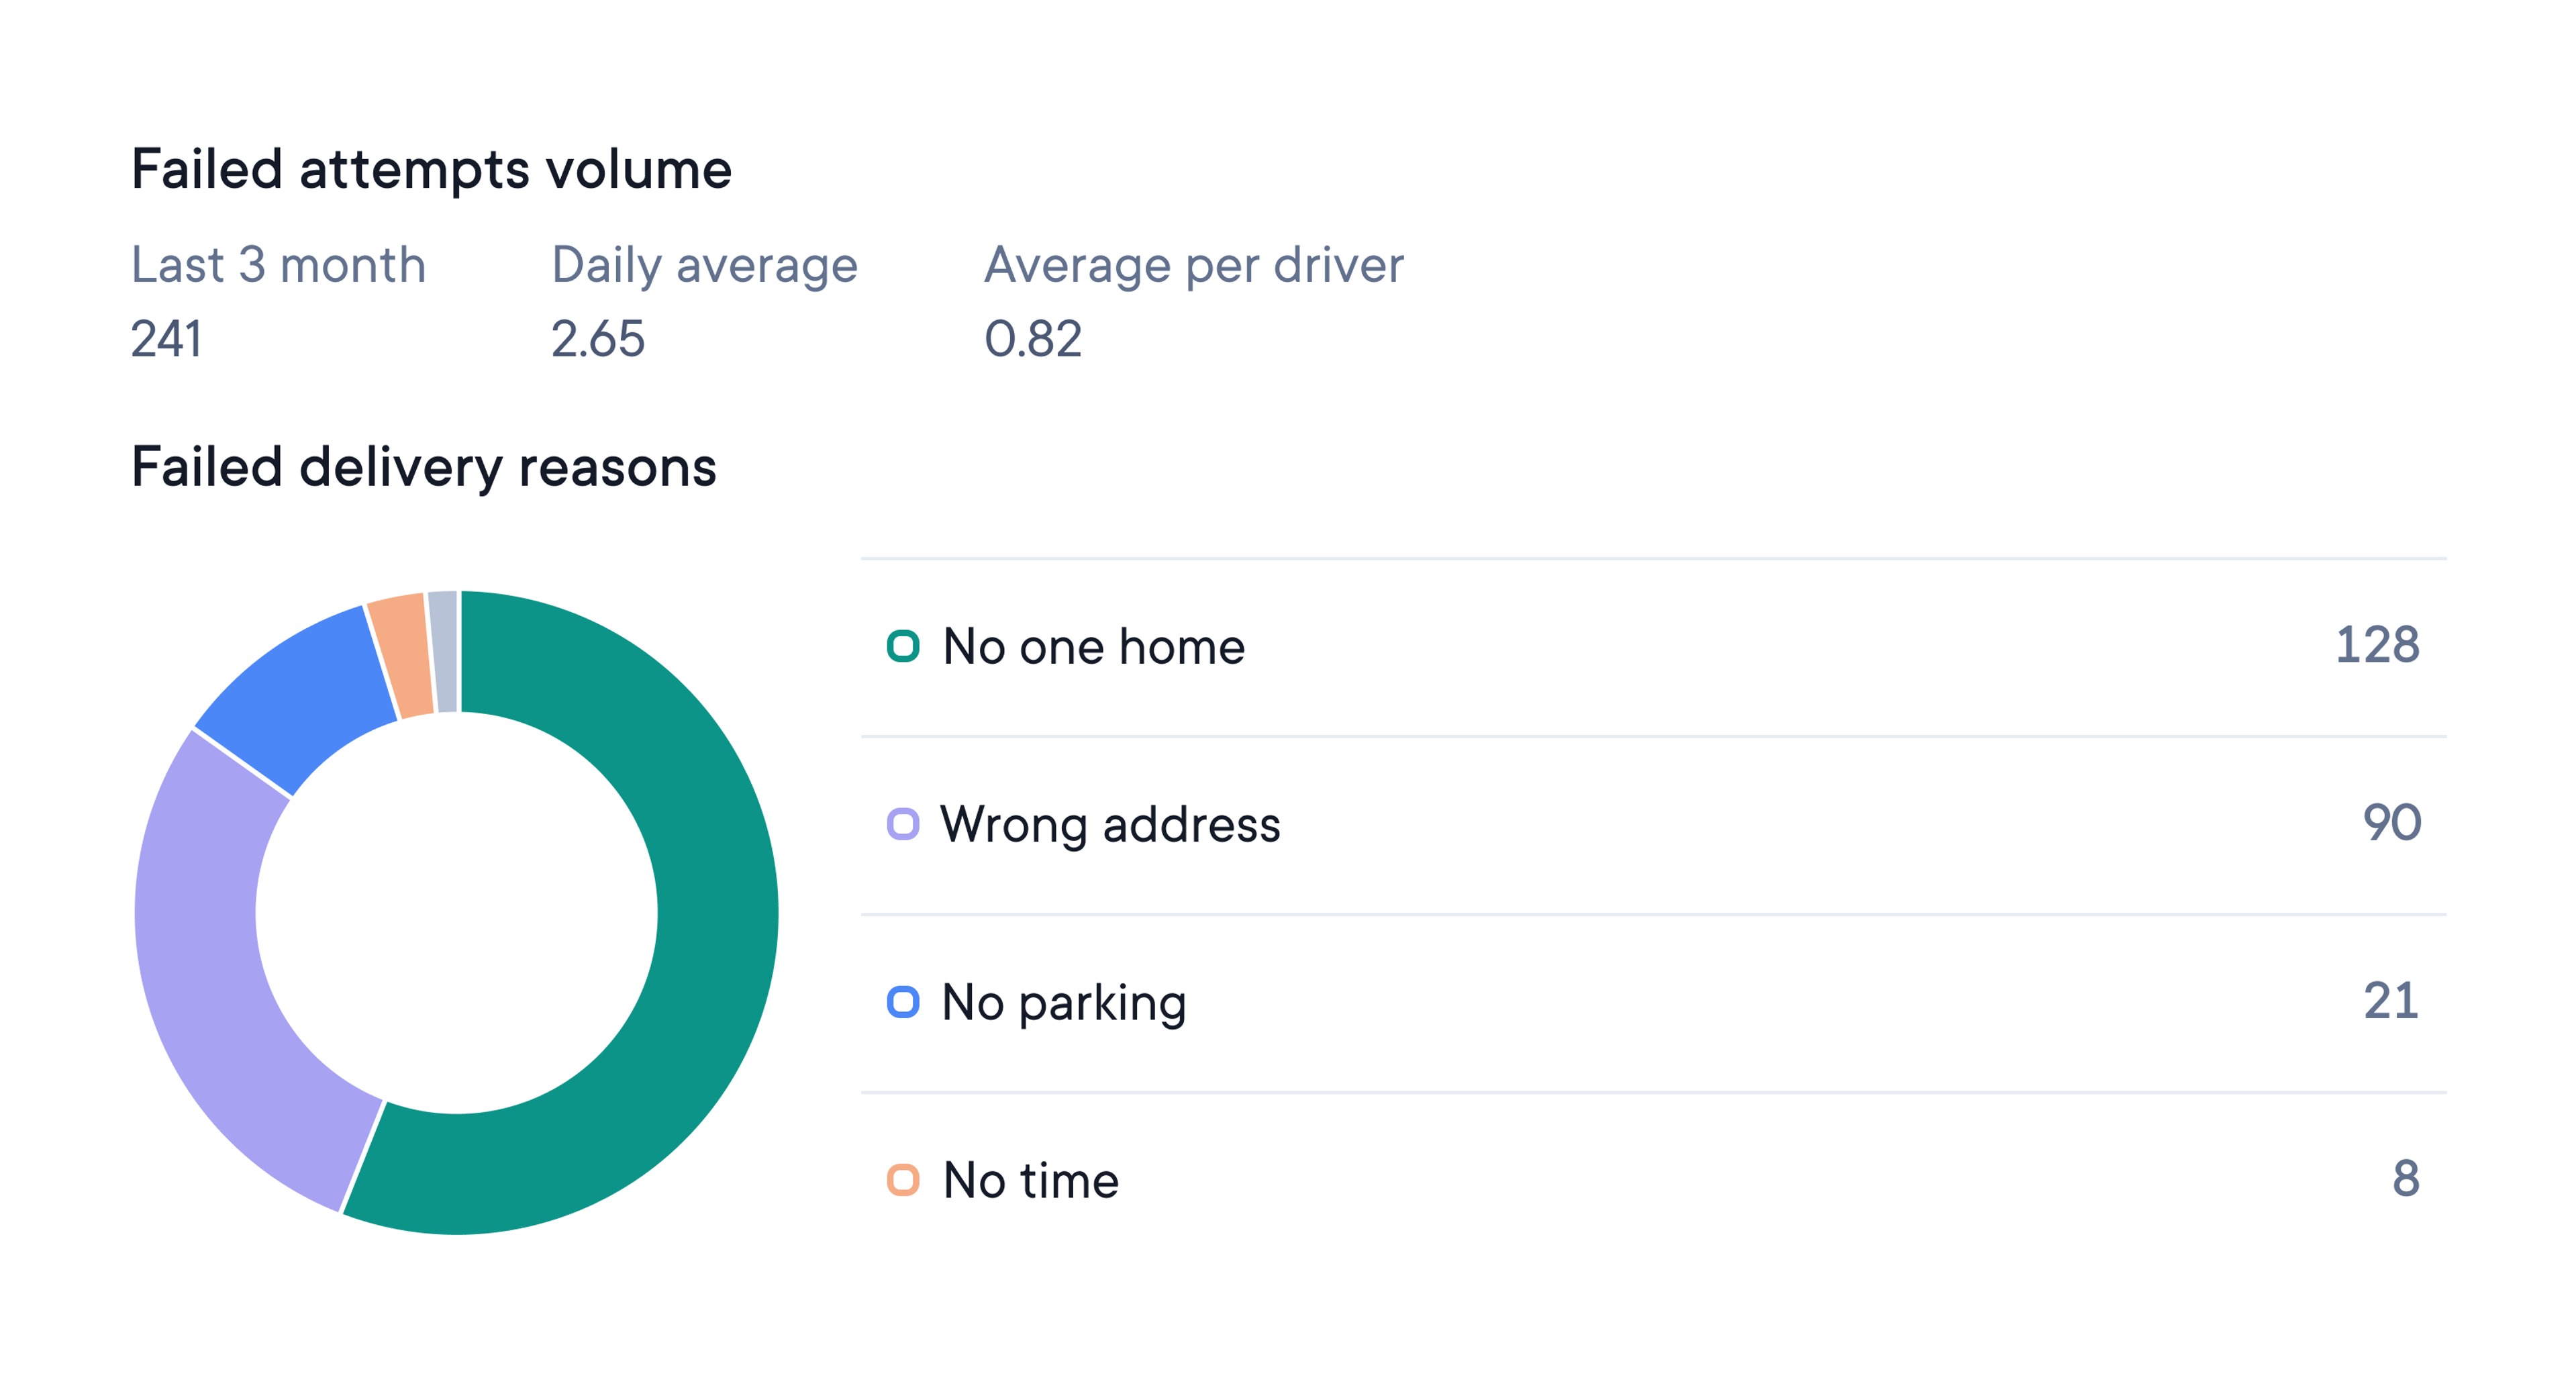
The Spoke Dispatch dashboard has several reports that give you the "why" not just the "what"
Problem 2: workload imbalance
Driver A finishes at 4pm, and driver B at 6pm. Both start the same time, with similar stop counts. But stop-count doesn't tell the full story. Driver A might be in dense residential areas, while driver B has commercial zones with loading docks and complex access.
"We often monitor drivers' expected finishing times.", says Mark, "That gives us an indication of route workload balance and we use that metric to build fairer routes for the drivers and look after driver welfare."
When you fix imbalances, you don't just improve fairness – you improve retention. Burnt-out drivers quit and replacing them costs even more money.
Problem 3: hidden labor time
Your delivery analytics show a driver's stop-time doubling. Before deciding it's a performance issue, get the facts to back up your gut instinct.
Mark recalls, "... one driver didn't look busy but was always out until five or six o'clock. Then we noticed a 2-hour gap between delivery times. He was clearly doing something else, during paid work time."
The outcome? "We removed him and spread his workload among the other drivers. So we became more profitable on that contract. Scanner data doesn't show evidence between scans – not like when you can see it visually on a map."
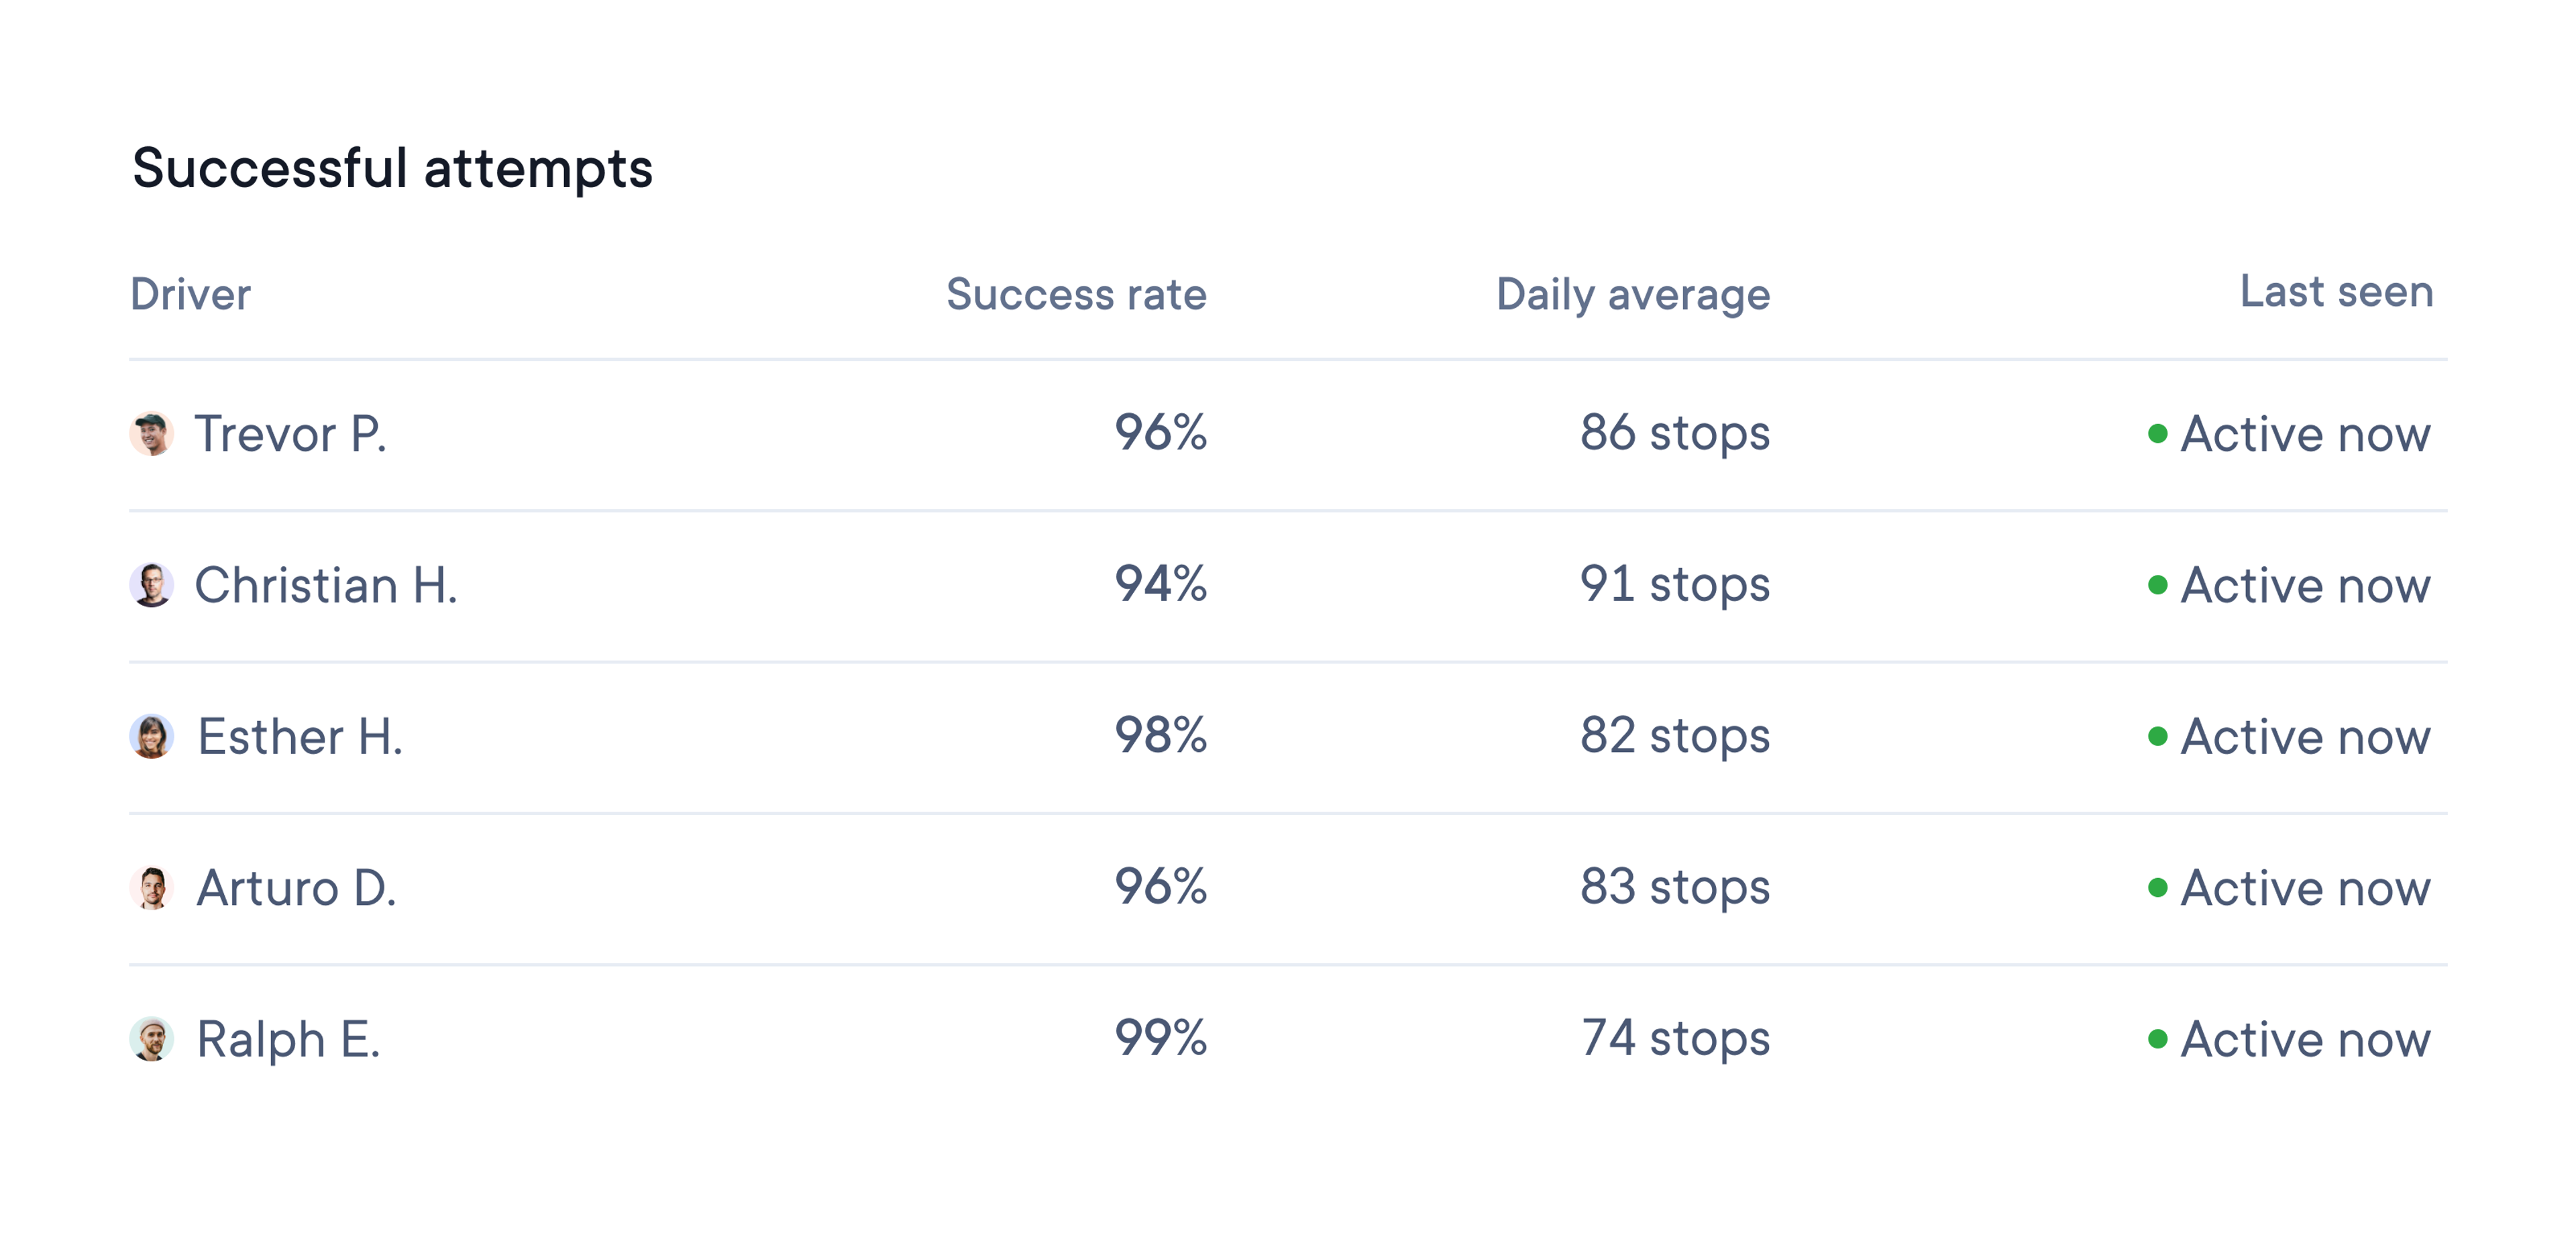
Spoke Dispatch's last mile delivery analytics allows you to examine individual driver statistics
Problem 4: route mismatch
There are routes that consistently run late – from chronic traffic, complex building access (e.g. gated/security apartment complexes) or consistent poor address data. But equally “… an experienced driver in a city can cover a lot of deliveries, whereas an inexperienced one might take two days to do what the experienced driver can do in one" Mark explains.
Combining delivery analytics with experience, shows exactly which routes are potential mismatches. Mark explains:
We look at the data and talk to the drivers. If we noticed a driver wasn’t doing well in a certain area, we might change route locations, swap drivers between routes or add a route and reassess after a few days.
Problem 5: unprofitable contracts
Not all delivery work is profitable. Mark learned this with pallet deliveries: "We were using freight forwarders to cover some regions. In the end, it became unprofitable because there isn't much margin on that work and paying a third party, it all starts to stack up."
What did they do? "We stopped offering the service. We decided to focus on last mile deliveries – our bread and butter – and leave the pallets behind."
The 3 last mile delivery analytics lenses that matter
There are three lenses through which to view your metrics and delivery operation.
Lens 1: reliability
What you're measuring: Completing deliveries on time and on first attempt – or not.
Why it matters: Failed deliveries and late arrivals directly erode customer trust and trigger financial penalties. Last mile research shows that 76% of Gen X, 81% of Millennials, and 86% of Gen Z say their delivery experience impacts a decision to order again.
Analytics signals: First-attempt success rate, late delivery patterns, address issues, building access problems.
Megan Murphy, General Manager of Spoke Dispatch, explains:
"The most common thing we see is when dispatchers have visibility into driver-specific metrics, they spot things like lateness and successful versus failed delivery rates. The goal is to keep failed attempts and lateness to a minimum, because that erodes customer trust – which is one of the most valuable currencies a courier has."

Lens 2: efficiency
What you're measuring: How productively you're using resources – driver time, vehicle capacity, route design.
Why it matters: Inefficiency is your profit leaking in slow motion. An extra 30 minutes per route, across 10 drivers daily, is 50 hours of wasted labor per week.
Analytics signals: Route duration variance, stop time patterns, driver finishing times, idle time.
As Megan explains: "Stop density varies dramatically across urban, suburban, and rural environments, and it directly impacts driver productivity. Setting the right delivery zones ensures you maintain a stop density that's actually desirable for the business."
Lens 3: profitability
What you're measuring: The economics – which work makes money, and which work loses it.
Why it matters: Volume without profitability isn’t sustainable work.
Analytics signals: Cost per delivery by client/route/type, contract economics, overtime patterns, resource utilization.
"On average, we'd use cost per delivery about once per month – usually when we're deciding on new contracts," Mark says. "We also use it when looking at consolidating routes. We have three or four different companies that co-load with us and all pay different price points, so it's only by looking at cost per delivery that things really make sense."
How real courier teams turn analytics into profit
Theory is nice. But let's look at how experienced operators really use analytics to solve problems and generate profit.
On the surface, different deliveries can look equal, yet their actual cost to complete can vary considerably.
For example: A residential delivery at 3pm may cost you $7 to complete. You think a commercial delivery’s the same, but haven't factored in the loading dock coordination and multiple access points, so it’s really costing you $11. If you’re charging $10 for both, one is bleeding your margin, the other’s making up for it. That only works when the volumes are in the right proportions – otherwise you’re losing money fast.
Here's four real examples using the delivery analytics formula:
Data signal → Operator adds context → Action taken → Results measured
Case Study 1: ND scan spike → reveals hidden workload
Mark's team inherited data from DHL showing non-delivered (ND) scan percentages for each route.
Signal: "We studied the data day after day and noticed one route consistently trending upwards for ND scans," Mark recalls.
Context: "We discovered there’d been an increase in volume on the route, and the driver hadn't mentioned it. He was trying to manage it himself, maybe finishing at six even though he still had another hour of deliveries left."
Action: "We moved some of his area onto another driver, which helped balance the volume across all the drivers."
Result: "We reduced complaints and kept our driver happy."
Takeaway: Sometimes your best drivers suffer in silence rather than complaining about workload increases. Analytics reveals what they won't tell you.
Case Study 2: Failed deliveries → reveals access issues
Signal: The analytics show a spike in first-attempt failures concentrated in one apartment complex. Failure reason: "recipient not available" or "access issue."
Context: Operations discovers the building requires deliveries to a specific office, but drivers don't have that information.
Action: Delivery instructions updated with clear building access details.
Result: First-attempt success jumps to 98%, cost per delivery normalizes, customer complaints drop to zero.
Takeaway: Patterns in your data often point to fixable systemic issues, not individual driver problems.
Case Study 3: Driver finishing times → reveals unfair workload
Signal: "We often monitor drivers' expected finishing times," Mark explains, “… and noticed a driver wasn't getting home until nine o'clock."
Context: The route had complex commercial deliveries with loading dock requirements.
Action: “We used that metric to build routes that were fairer, to look after driver welfare."
Result: The driver now finishes 6-6:30pm. Morale improves, overtime costs drop, retention risk removed.
Takeaway: "Fair" doesn't mean "equal stop count." Fair means equal difficulty and equal time commitment.
Data doesn't replace experience – it amplifies it
Many experienced dispatchers worry that analytics make gut instinct and experience obsolete. It doesn't.
You can't compare two routes without understanding the roads, buildings, or the driver. Numbers alone can lie.
Mark's point is critical. Gut + data = profit. Not one or the other. Analytics may tell you Route A took 2 hours longer than planned, but it can't tell you why unless you know it includes a difficult apartment complex, or the driver is new to that area, or roadworks started last week.
"Generally, we talk to the drivers and look at the data," Mark says. "If it turns out volume was just up and the driver was doing the best he could, we'll add an extra route to cover it."
The true value of last mile delivery analytics is the validation of patterns your gut senses but can never prove.
Four places where experience catches what data can't
1 - New drivers take longer – and that's okay.
A new driver taking 20% longer than a veteran isn't a performance problem – it's a learning curve.
2 - Route familiarity affects stop times.
A driver who's covered the same neighborhood for 3 years is always faster than someone temporarily rotated into that route.
3 - Geography matters more than distance.
Twenty stops in dense urban areas might take 3 hours, while twenty rural stops with 5–10-minute gaps might take 6 hours.
4 - Drivers still need autonomy.
Experienced drivers sometimes deviate from the plan because they know something the algorithm doesn't.
Why mid-sized courier companies get fast ROI from data
Mid-sized courier operations sit in a strategic sweet spot when it comes to last mile delivery analytics ROI. You benefit MORE from delivery analytics, because there’s less margin for error in your operational planning and execution and you can immediately act on insights. Big fleet companies can’t.
1 - Small teams instantly feel inefficiencies
When you're running 10+ drivers with 5,000+ stops a month, every inefficiency hits hard. A route that runs 30 minutes over plan isn’t absorbed – it's visible, blows out overtime and stops you taking on more volume.
2 - The math that matters for profitable deliveries
For a mid-sized courier completing 5,000 stops per month, saving just $0.40 per delivery through efficiency improvements translates to $24,000 annually in profit improvement that drops straight to your bottom line.
Where do those savings come from? Reducing failed deliveries, cutting overtime through workload rebalancing, eliminating underutilized vehicles, and exiting unprofitable contracts.
3 - Your agility advantage over big couriers
Mark's team perfectly demonstrates agility. When they spotted a pattern with late business deliveries tied to air freight timing, they redesigned their route structure within days. "It worked out really well – it solved the issue completely," Mark explains.
That's your competitive advantage. You can iterate weekly instead of quarterly and test a route adjustment on Monday and measure results by Friday. As Mark says, "We're quite quick to make a move – changing route locations or swapping drivers between different routes."
In mid-sized operations, dispatchers and ops managers are empowered to act. You don't need a data science team. All you need is clear visibility into the signals that matter – failed deliveries, stop times, finishing times, cost per delivery – so you can act when patterns emerge.
How Spoke Dispatch helps you see the signals faster
Spotting failed delivery patterns, balancing driver workloads, identifying unprofitable contracts, all hinge on one thing. Visibility. And that’s where last mile management technology comes in.
When asked what holds courier companies back, Marks says "I think it's the right tools, and probably competency as well. […] I see companies not being able to collect the data properly or transform it into meaningful reports.”
Built for operators, not data scientists
Spoke Dispatch solves this issue with analytics built to match the way operators think – not as raw data dumps, but as decision-ready insights and visualizations.
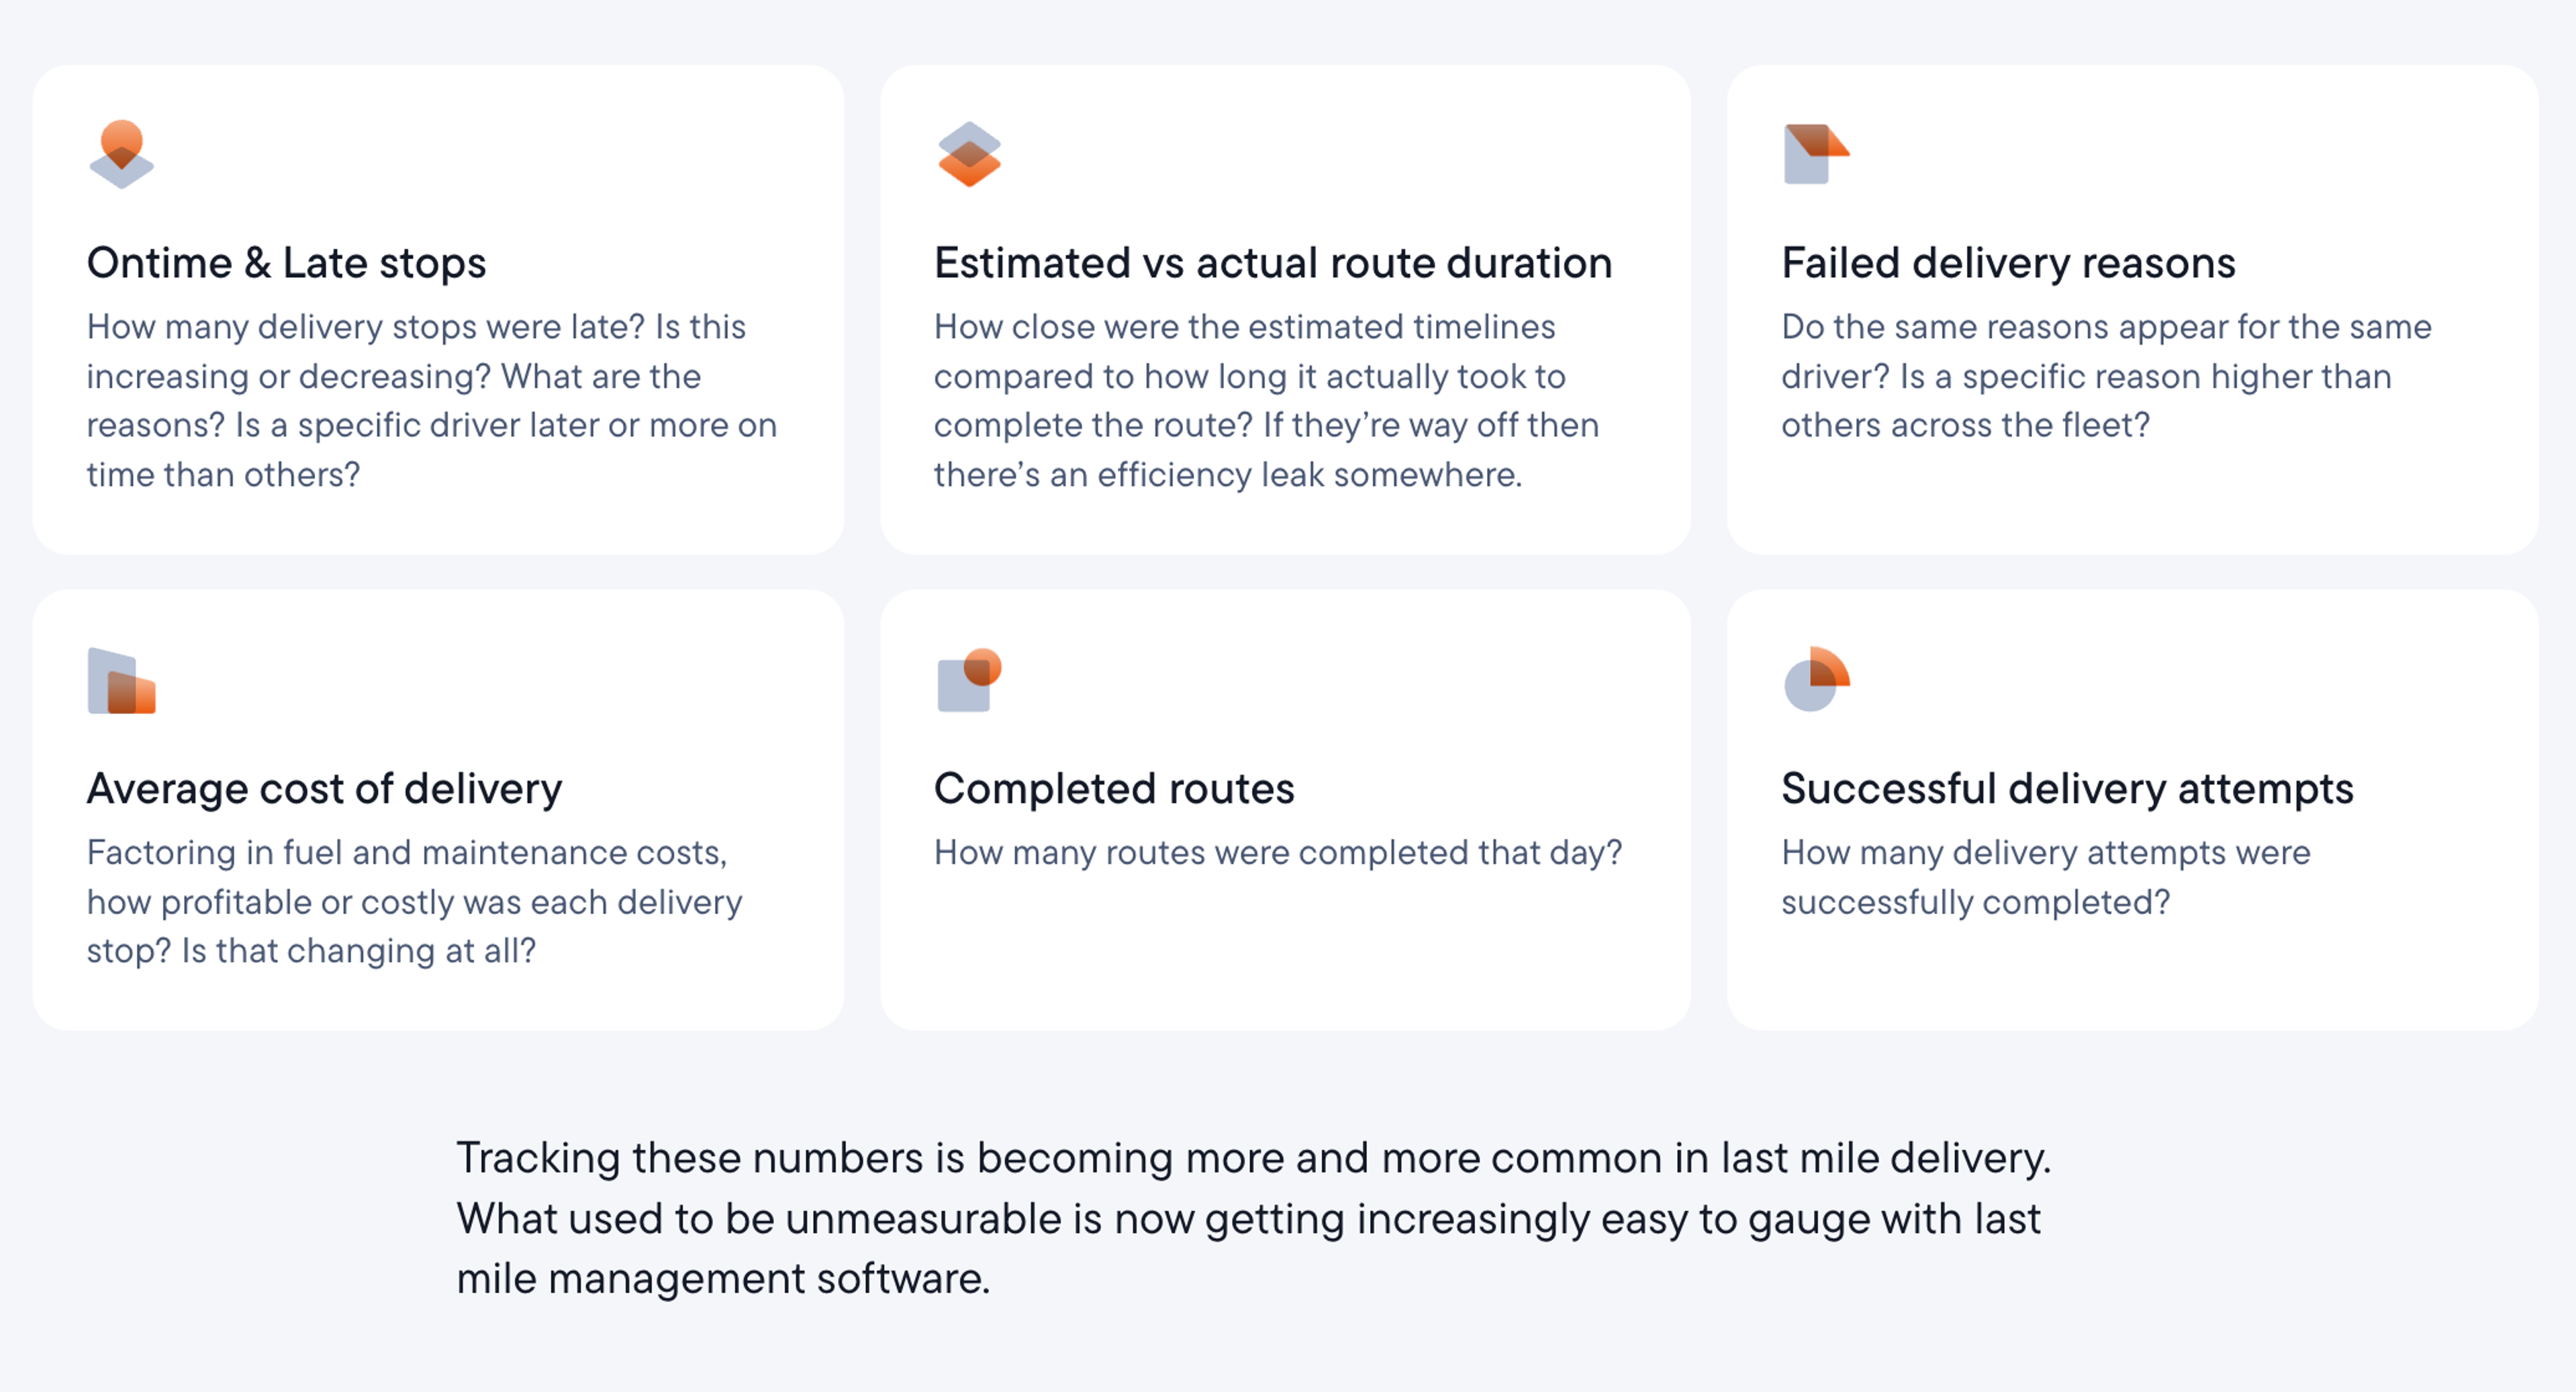
Six reports answer the questions that drive your daily decisions:
On-Time & Late Stops Report
Reveals which zones consistently miss time windows
Estimated vs Actual Route Duration Report
Compares estimated vs. actual delivery times.
Failed Deliveries Report
Shows you why deliveries are failing so you can address root causes.
Average Cost Per Delivery Report
Tracks your profitability metric over time.
Completed Routes Report
Tracks the number of routes completed.
Successful Delivery Attempts Report
Shows your completion rate over time with trends.
Reducing the "sea of spreadsheets"
"Ideally what you want to see is bar graphs with progress and to be able to compare one driver's performance this week to next week," Mark explains.
Spoke Dispatch bridges the gap between the sea of spreadsheets and isolated charts. Reports can be filtered by depot, team, or driver, and show comparisons of performance side-by-side. You can even identify patterns in historical data to anticipate seasonal staffing needs.
Megan expands on this point:
I think couriers expect any software they use to reveal insights with almost no heavy lifting on their part. Couriers shouldn't have to do extra work to get value from the data that's already being collected simply by using the product.
Spoke Dispatch gives you decision-ready analytics built for courier workflows — not data teams. Sign up for a free 7-day trial today.
Analytics isn't just dashboards. It's about decisions.
Remember that goldmine of delivery data we mentioned at the beginning?
The difference between couriers who extract value from their delivery analytics and those who don't, isn't based on the volume of data they collect. It's whether they've moved from tracking to deciding.
Every failed delivery has a story, and price tag. And your data contains those details, but it’s only when you combine those signals with operations experience, that your operational profit grows.
As a seasoned logistics expert, Mark notes "In six months, I'll probably have a whole new set of answers to these questions." And that’s the key point with last mile delivery analytics. As your operation matures, your analytics skills mature, but the principle stays constant: data reveals what's happening, experience explains why, and action drives profit.